Global and regional drivers for exceptional climate extremes in 2023-2024: beyond the new normal
Abstract
Climate records have been broken with alarming regularity in recent years, but the events of 2023–2024 were exceptional even when accounting for recent climatic trends. Here we quantify these events across multiple variables and show how excess energy accumulation in the Earth system drove the exceptional conditions. Key factors were the positive decadal trend in Earth’s Energy Imbalance (EEI), persistent La Niña conditions beginning in 2020, and the switch to El Niño in 2023. Between 2022 and 2023, the heating from EEI was over 75% larger than during the onset of similar recent El Niño events. We show further how regional processes shaped distinct patterns of record-breaking sea surface temperatures in individual ocean basins. If the recent trend in EEI is maintained, we argue that natural fluctuations such as ENSO cycles will increasingly lead to amplified, record-breaking impacts, with 2023–2024 serving as a glimpse of future climate extremes.
Introduction
As climate change advances, each year brings numerous broken climate records and uncharted climatic conditions1,2,3,4,5,6,7, engendering the sense that climatological norms are no longer representative of “normal”8. However, the conditions of 2023 and early 2024 stand out as extraordinary, even in the context of a new normal. Unprecedented summertime heat across the Northern Hemisphere brought catastrophic impacts to many regions of the globe, including heat waves, droughts, wildfires, and extreme rainfall and flooding9,10,11,12,13,14,15,16. The Paris Agreement established the objective to pursue efforts to limit global mean temperature increase to 1.5 °C above pre-industrial levels, but in 2023, more than two-thirds of individual days surpassed this target (https://climate.copernicus.eu/record-warm-november-consolidates-2023-warmest-year) and in 2024 annual mean air-temperature has exceeded this threshold for the first time (https://climate.copernicus.eu/copernicus-2024-first-year-exceed-15degc-above-pre-industrial-level). The ocean bore particularly dramatic signatures of extreme temperatures, with between 30% and 40% of the global ocean area experiencing a marine heat wave each month from April through December 202317,18,19, and drastic decline of global sea-ice20. Here we show that the climate conditions of 2023 and early 2024 were exceptional even when recent climatic trends and large-scale climate variability are taken into account.
Whilst many timely publications provide important information about the anomalous conditions in 202319,21,22,23,24,25,26,27,28, further efforts are needed to understand these exceptional climate conditions, their implications, and the potential for recurrence. We contribute to this effort in three novel ways. First, we propose and apply an objective statistical analysis method to determine significance of the recent extreme conditions while accounting for recent climatic trends and past variability. The “Abnormal record-Breaking (AB) test” (“Methods”, Supplementary Fig. 1) provides a robust, simple, and versatile statistical test which can be widely applied to climate variables and indicators to evaluate extreme conditions. Next, we quantify the contribution of the Earth’s energy imbalance (EEI) to the exceptional heat extremes observed in the ocean and atmosphere in 2023–2024 by comparing it to the onset of other major recent El Niño events. Our results show that the EEI contribution to the warming of the upper ocean and atmosphere exceeded previous events by 75%. Third, we provide further insight into two specific regions, the subtropical Northeastern Atlantic and the Southern Ocean, which show extreme conditions in 2023 linked to shortwave radiation and atmospheric circulation, respectively. We discuss the possible role of internal variability related to these events and highlight the need for further research on attribution of such extremes.
Results
Exceptional climate conditions
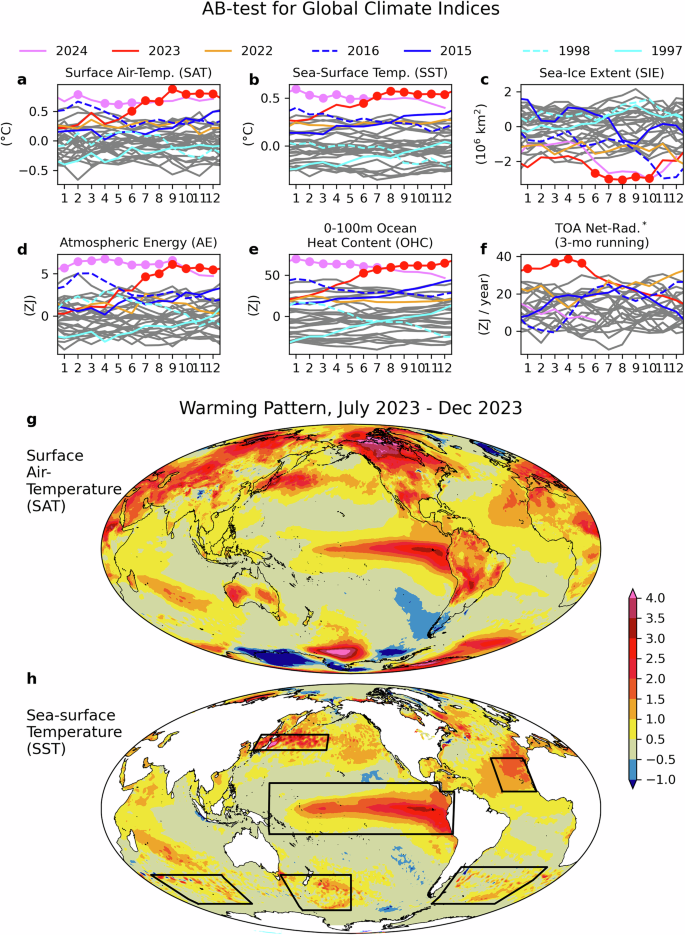
Abnormal record-breaking conditions began in June of 2023 for two of the most widely used global climate indices: globally averaged surface air-temperature (SAT) (Fig. 1a) and sea-surface temperature (SST) (Fig. 1b). Global sea-ice extent (SIE) also exhibited abnormal record-breaking in mid-2023, mainly due to a reduction of sea ice around Antarctica (Fig. 1c). These results emphasize that the global climate in 2023 not only broke records, but also broke records by wide margins—even when accounting for the recent progression of global warming. Similar results to those for SAT and SST are found for atmospheric energy (AE) (Fig. 1d) and near-surface (0–100 m) ocean heat content (OHC) (Fig. 1e). These four variables (SAT, SST, AE, and OHC) are highly correlated (correlation coefficients between any two are above 0.85 when considering a 3-month running average), however, near-surface OHC anomalies are ten times larger than typical AE anomalies. This motivates our detailed OHC analyses in the subsequent sections as even small OHC changes have large impacts on AE and SAT/SST and how they evolve with time (Supplementary Fig. 2). Net top-of-atmosphere (TOA) radiation observations from the Clouds and the Earth’s Radiant Energy System (CERES) also exhibited abnormal record-breaking conditions in early 2023 (Fig. 1f). In the next section, we show that this exceptional heat was predominantly stored in the top 100 m of the ocean, which led to rapid increase in top-100 m OHC during this period.
Monthly values of global climate indices of a SAT, b SST, c SIE, d AE, e OHC in upper 100 m, and f TOA Net Radiation. Months that pass the AB-test are indicated by filled circles. The data shown are global averages for (a) and (b), and global integrals for (c)–(f). All fields are anomalies relative to the 1993–2022 climatology, except for TOA net radiation in (f), which is shown as a mean-retained anomaly (see “Methods”) to indicate the sign’s importance as an indicator of energy accumulation or loss, with a reference period of 2001–2022. The start year of the plot is 1993, except for TOA net-radiation which starts in March 2000. Previous super El Niño years (1997/1998 and 2015/2016) and recent 3 years (2022, 2023, and 2024) are shown by colored lines as indicated by the legend. July–December averaged g SAT and h SST anomalies over the globe.
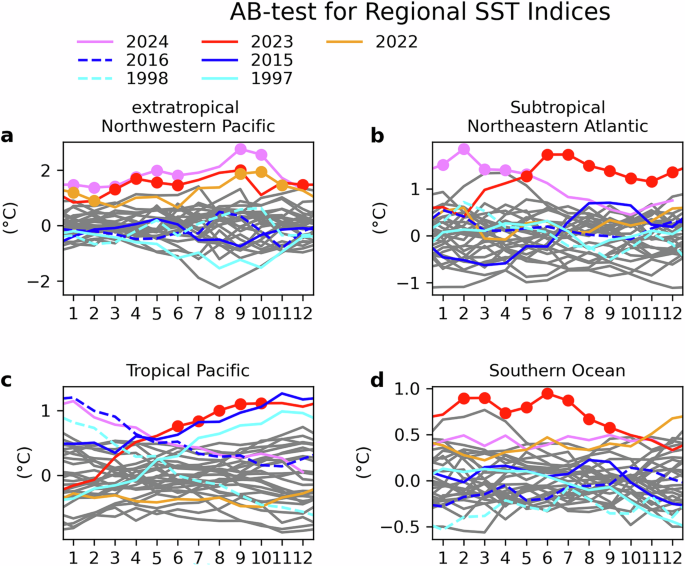
Temperature anomalies during the latter half of 2023 (July–December) show a distinctive spatial structure (Fig. 1g, h) that is quite different from the much more spatially uniform pattern of warming over the last ~75 years (Supplementary Fig. 3) and resembles a positive El Niño-Southern Oscillation (ENSO) phase in the tropics29. Regional SSTs averaged over each of the four regions in Fig. 1h (indicated by boxes) highlight different times of emergence of abnormal record-breaking conditions for each region (Fig. 2a–d).
The time series represent the extratropical Northwestern Pacific (a), the subtropical Northeastern Atlantic (b), the tropical Pacific (c), and the combined three-areas in the Southern Ocean (d) relative to the 1993 to 2022 climatology. The respective regions are shown by the boxes in Fig. 1h.
SSTs in the extratropical Northwestern Pacific first exhibited abnormal record-breaking conditions in early 2022, with most months since September 2022 continuing through June 2024 passing the AB test. The subtropical Northeastern Atlantic first showed abnormal record-breaking conditions in May 2023, continuing unabated through May 2024. In the tropical Pacific, on the other hand, abnormal record-breaking conditions occurred between June and October 2023, though the anomalous SSTs in this region were on par with those observed during the 2015/16 Super El Niño (dark blue lines). However, neither of the two most common El Niño indices (i.e., Niño 3.4 and Niño 3) were record breaking in 2023 (Supplementary Fig. 4). The 2023 warming in the tropical Pacific is broader in latitude than the warming in the previous Super El Niños. Abnormal record-breaking conditions began in the Southern Ocean in February 2023, lasting through September 2023. The Southern Ocean anomalies reach abnormal record-breaking conditions first, at the start of the Southern hemisphere summer. The earlier emergence of AE anomalies in the Southern hemisphere is evident in Supplementary Fig. 2.
Global energy perspective
What led to the record-breaking warmth of 2023? A central factor is Earth’s energy budget, which describes the difference between incoming solar radiant energy absorbed by Earth and outgoing thermal infrared radiation emitted to space (Fig. 3a, b). Both quantities show large fluctuations on interannual times scales associated with ENSO fluctuations, consistent with earlier literature30,31,32. During El Niño phases the EEI drops rapidly, even turning negative during the 2010 and 2016 events, indicating a net Earth’s energy loss. However, over the past two decades, an exceptional trend in EEI (Fig. 3b) has been observed from satellite TOA radiation, in-situ ocean, and satellite altimetry and space gravimetry measurements3,4,33,34. This extra energy input has rendered the system significantly warmer, particularly within the ocean below 100 m (see Fig. 3d). This prolonged build-up of energy into the climate system is associated with an unprecedented increase in TOA absorbed solar radiation (ASR) that is only partially compensated by a weaker increase in outgoing longwave radiation (Fig. 3a). The ASR changes have been linked to decreases in low and middle cloud fraction in middle-to-high latitudes in the northern hemisphere and decreases in middle cloud fraction in the southern hemisphere1.
a Anomalies of downward shortwave and downward longwave radiation and multivariate ENSO Index (MEI); b mean-retained anomalies of TOA downward net radiation or EEI and MEI; c AE anomalies per unit pressure; and d OHC anomalies per unit depth for the Argo period since 2006. Anomalies in CERES data are calculated relative to 2001–2022, while anomalies in other data are calculated relative to 1993–2022. Time series shown in a and b are smoothed by a 3-month running average. The vertical gray dashed and dotted lines in each panel indicate the 1-year period over which the heat budget analysis in Fig. 4 is conducted for each of three El Niño events.
From mid-2020 to mid-2023, three consecutive years of La Niña conditions contributed to a further increase in TOA net downward radiation, injecting about 68 ZJ of energy into the system, equivalent to 23% of the total energy accumulation for 2000–2023 (Fig. 3a, b). During the first part of 2023, the net TOA flux set a record-breaking abnormal increase between December 2022 and June 2023 (Fig. 1f), followed by a decrease at the onset of the El Niño in May 2023. Near-surface OHC (top 100 m layer) within the ocean and AE also increased between December 2022 and June 2023, and then intensified further during the 2023 El Niño event (Fig. 1d, e).
These changes align with the expected energetic impacts associated with the growth and decay phases of El Niño in the tropics35,36,37,38,39,40. Specifically, as is common during the transition from La Niña to El Niño conditions, early 2023 is marked by positive SST anomalies in the Eastern and Central Pacific, coinciding with a deepening of the thermocline in the eastern and central Pacific and a shallowing of the thermocline in the western Pacific, likely driven by wind forcing. This flattening of the thermocline (Fig. 3d) leads mechanically to an increase in the near-surface OHC (0–100 m) and a decrease between 100 m and 300 m (Supplementary Fig. 5) (see also refs. 38,41). Changes in AE follow those in the 0–100 m OHC layer a few months later (Fig. 3c and Supplementary Fig. 5).
While the vertical redistribution of heat within the ocean during the 2023 El Niño is similar to that observed during the 2010 and 2016 major El Niño events, heating of the near-surface layer is markedly different (Fig. 4 and Supplementary Table 2). Our selection of the previous ENSO events is limited by the observed OHC record through Argo, which became operational in 200642 (Supplementary Fig. 6) The cooling between 100 m and 300 m depths and the integration of TOA net radiation are of similar magnitudes for the recent warming event. However, the increase in EEI between the current event and previous events is significantly larger than the increase in 100–300 m cooling. Specifically, the cooling between 100–300 m from November 2022 to November 2023 surpasses the previous maximum cooling (February 2009 to February 2010) by only 4.8 ZJ. In contrast, TOA net radiation from November 2022 to November 2023 is 13 ZJ higher than the previous peak heating (December 2014 to December 2015), marking an increase of over 75%. This extra heat is largely stored in the atmosphere and the upper ocean, as evidenced by the observation that the increases in combined AE and 0–100 m OHC were over 50% larger in the 2023 El Nino than occurred during the 2010 and 2016 El Niños.
These periods —a 2010 Feb–2009 Feb, b 2015 Dec–2014 Dec, and c 2023 Nov–2022 Nov— are selected to capture the strongest 1-year warming in 0–100 m OHC associated with each El Niño event. The OHC changes are calculated from the difference between two 3-month averages separated by 1 year (e.g., the difference in a is between the mean of Jan–Feb–March 2009 and that of 2010), while the TOA net radiation is integrated over the 1-year period between the midpoints of these 3-month intervals. Uncertainty (see “Methods”) of each respective estimate is indicated by green lines. The number above each bar indicates the height of the bar in units of ZJ.
The abnormal record-breaking conditions in 2023 thus resulted from the combination of the long-term positive EEI trend, the 3 year La Nina conditions, and the switch to El Niño. A recent analysis of outputs from the Climate Model Intercomparison Project Phase Six suggests that the transition from a multi-year La Nina to an El Nino substantially increase the EEI43. The long-term trend in EEI is due to a positive radiative forcing resulting from continued emissions of well-mixed greenhouse gases and reductions in aerosol emissions in some parts of the northern hemisphere due to air quality legislation21,44,45,46. A recent assessment suggests that climate models fail to capture the exceptional global mean temperature increase in 202347 or the modeled probability is extremely low40. A key reason may lie in the models’ representation of the unprecedented observed changes in Earth’s energy budget. Clearly, further analysis is required to fully test the models.
Regional extreme events
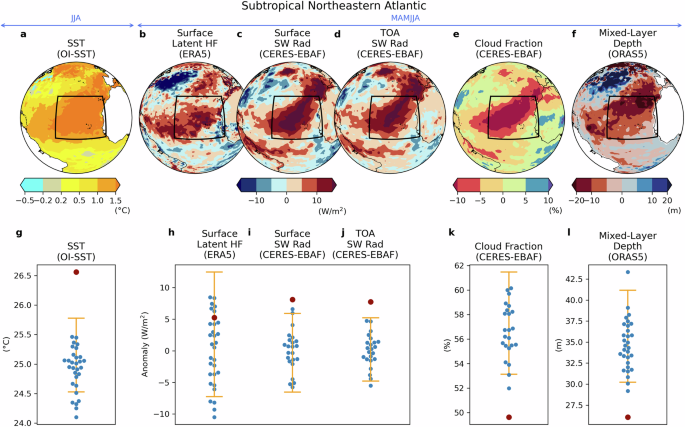
In addition to its key role in the global heat budget, there is evidence in the CERES data that the exceptional TOA net radiation played an important role in regional SST anomalies over the subtropical Northeastern Atlantic (Fig. 5a) during boreal spring and summer 2023. When we examine shortwave and longwave radiation of CERES and latent and sensible heat fluxes from ERA5, the strongest heating is given by surface shortwave radiation, which is abnormal record-breaking and larger than the latent heat flux (Fig. 5b, c, h, i). The surface shortwave-radiation anomaly is consistent with the TOA shortwave radiation (Fig. 5d, j), and is accompanied by substantial reduction in cloud fraction (Fig. 5e, k), suggesting weakened cloud reflection resulted in increased shortwave radiation reaching the ocean.
(Top panels) Anomalies in the subtropical Northeastern Atlantic for a SST, b surface latent heat flux, c surface short-wave radiation, d top-of-atmosphere (TOA) shortwave radiation, e cloud fraction, and f mixed-layer depth. (Bottom panels) The corresponding area-averaged and seasonally-averaged data for each year (g) SST, (h) surface latent heat flux, (i) surface short-wave radiation, (j) TOA shortwave radiation, (k) cloud fraction, and (l) mixed-layer depth. In (g–l), the red dot represents the 2023 value, blue dots indicate 1993–2022 values, and yellow bars show the 5th–95th percentile of 2023 value estimation based on a linear regression model for the learning period between 1993 and 2022 for SST and mixed layer depth (g, l) and between 2000 and 2022 for CERES-EBAF data (i–k) due to the limited data availability and for latent HF (h) for consistency. The average range is between 10°–30°N and 40°–15°W.
Further analyses suggest that the reduced cloud fraction was mainly due to a decrease in low cloud (Supplementary Fig. 7). The important role of low cloud reduction in EEI increase is also emphasized by a recent study, which analyzed low cloud of ERA5 data27, whereas our results indicates that the low cloud reduction is also evident in MODIS data in this region (Supplementary Fig. 7). Aerosol optical thickness also exhibited a decrease in the south of the analysis area, but the pattern does not overlap well with the increase of the TOA shortwave radiation (Supplementary Fig. 7). In addition, the mixed layer depth was unusually shallow, displaying an abnormal record-breaking condition (Fig. 5f, i), likely the result of anomalously low winds in this region24 (Supplementary Fig. 7). This means that the surface temperature increases per unit heat flux (i.e. efficiency of the warming) was high in 2023. Although the ERA5 reanalysis data has some caveats48,49,50,51,52,53,54,55 in the analyzed fields, the results show consistency between them and point to the combined effect of an exceptionally weak wind and high surface shortwave radiation, in association with shallow mixed layer, as key factors for the temperature extremes over the subtropical Northeastern Atlantic. We note that there were also concurrent anomalies in atmospheric circulation (Supplementary Fig. 7), which would have contributed to the low wind speed.
In contrast to the subtropical Northeastern Atlantic, the warming pattern in the Southern Ocean, which exhibited abnormal record-breaking conditions from February through September, does not have a direct connection to local TOA net radiation but was closely related to abnormal atmospheric circulation anomalies. Figure 6a–d, f–i indicates that the anomalously warm SST and SAT and reduced sea-ice averaged between March and August 2023 were closely associated with a wave number 3 pattern in northerly wind anomalies in the Pacific, Atlantic and Indian sectors of the Southern Ocean. This pattern is known to play an important role in Southern Ocean climate including influencing Antarctic sea ice56,57,58.


댓글
댓글 쓰기